Audubon ยท Plugins
HWK-001  ยท  Released v1.0
Hawk Loudness Meter in studio context Hawk full plugin UI โ€” all meters active Hawk LUFS meter โ€” four measurement windows Hawk spectrum analyzer โ€” three modes Hawk true peak and phase correlation Hawk loudness history and goal line
NEW ยท VST3 PLUGIN EST. 2026 ยท AUDUBON AUDIO
Loudness Meter

Hawk.
Everything at once.

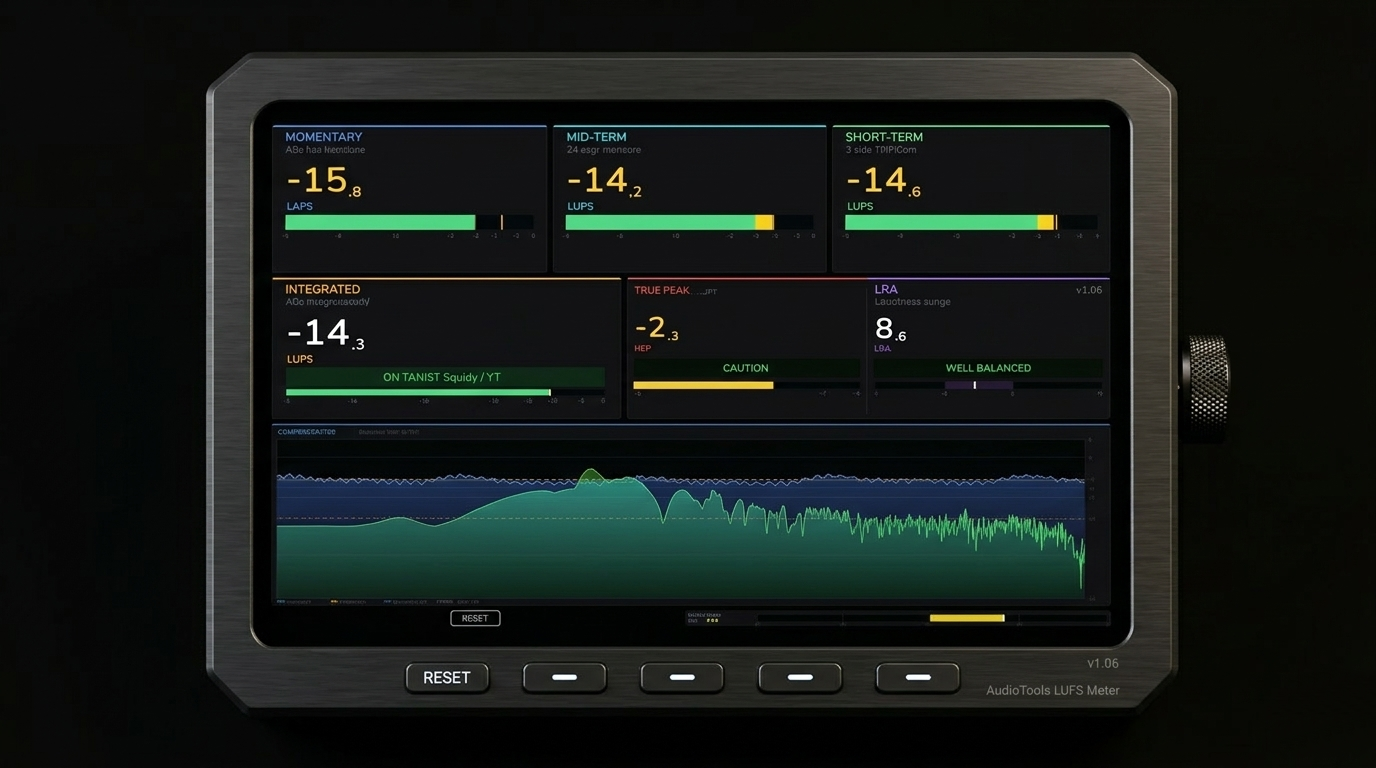
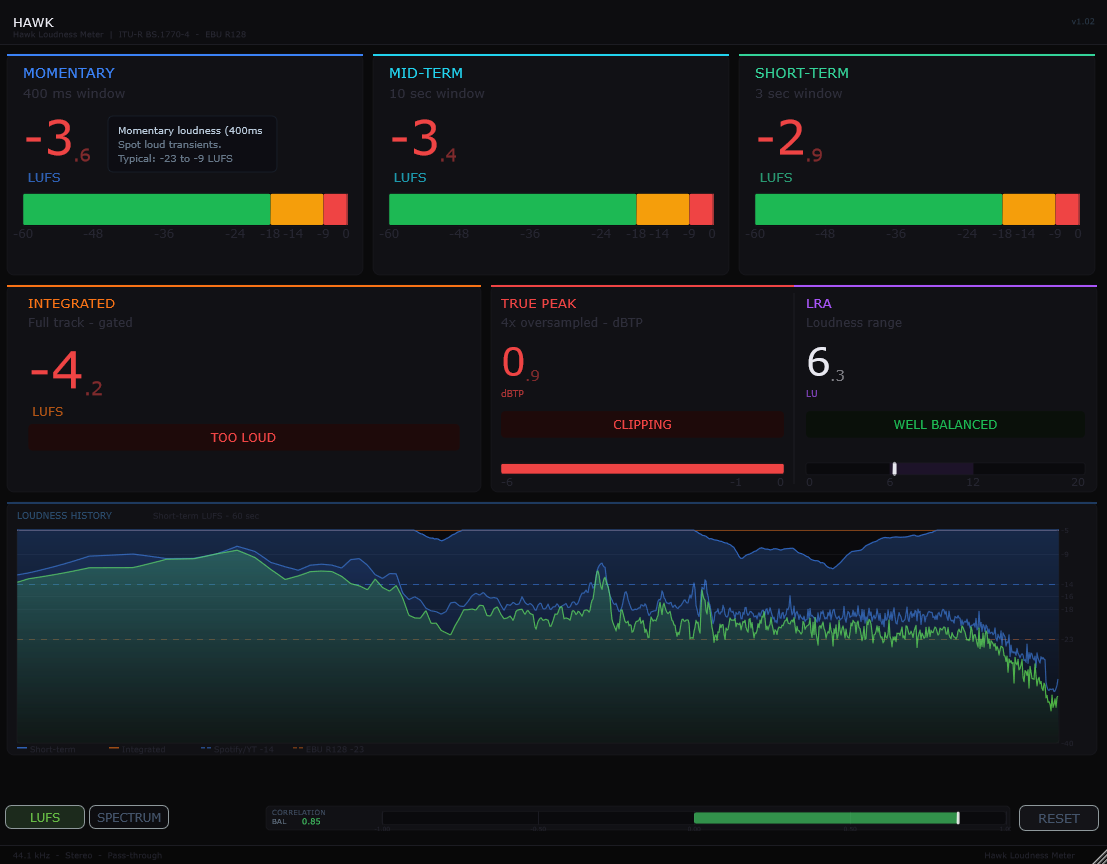
ITU-R BS.1770-4 LUFS across four time windows. A spectrum analyzer with three modes and a 4096-point FFT. True Peak at 4ร— oversampling. Phase correlation, loudness history, a goal line, and frozen peak. One plugin. All of it.

Free Add to Cart ยท v1.0
Free
01 / 06
Format
VST3 Win 64
Standard
BS.1770-4 EBU R128
FFT Size
4096 pt 3 modes
True Peak
4ร— OS inter-sample
License
Free commercial OK
01 โ€” Overview

The complete metering stack, in one plugin.

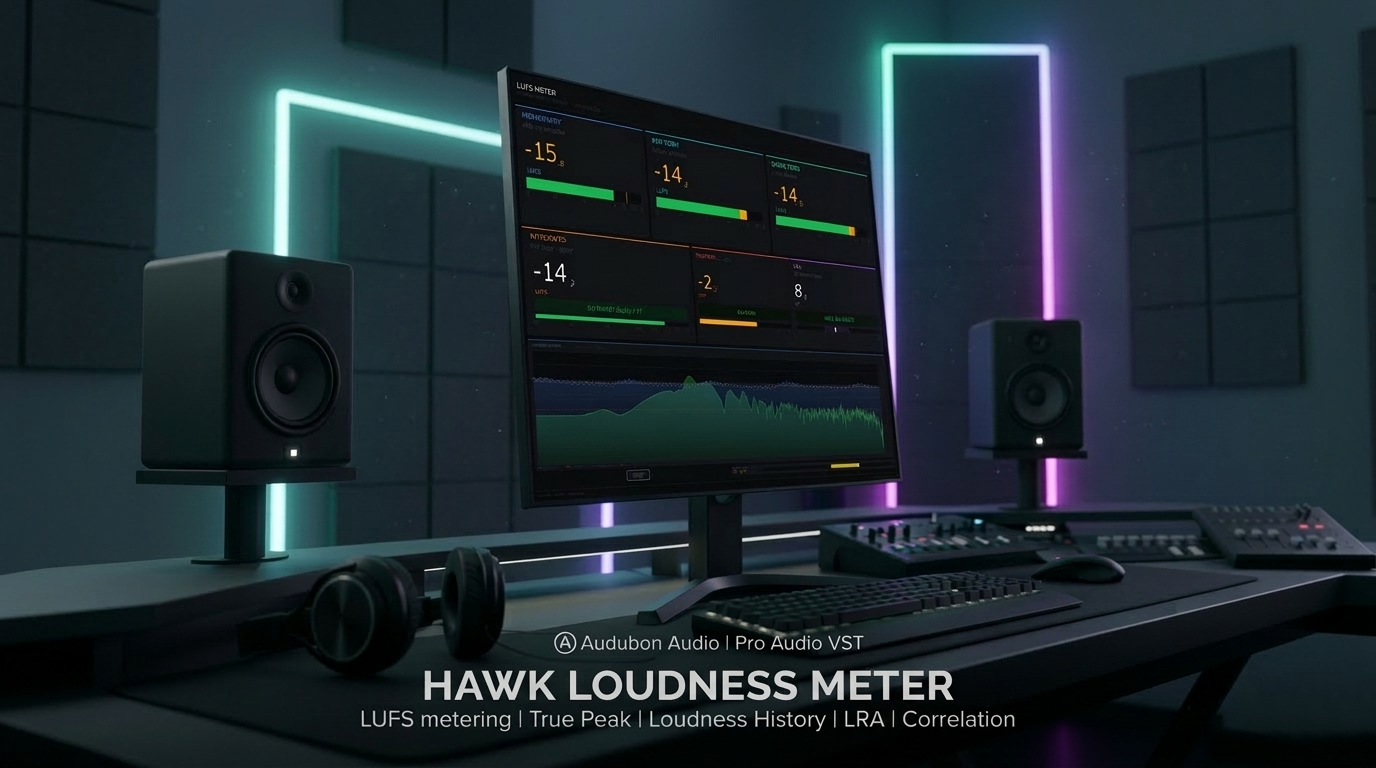
Hawk consolidates everything you need to measure loudness, spectral content, true peak levels, stereo phase, and mix history into a single VST3 insert. Built to the ITU-R BS.1770-4 and EBU R128 standards used by every major streaming platform.

VST3 ITU-R BS.1770-4 EBU R128 4096-pt FFT True Peak 4ร— OS

Every streaming platform normalizes your music to a target LUFS. Hawk tells you exactly where you are across four measurement windows simultaneously โ€” so you mix and master to the right number from the start, not after the fact.

Beyond loudness, Hawk's spectrum analyzer gives you a real-time frequency view of your mix in three modes, while the phase correlation meter, loudness history graph, goal line, and frozen peak readout fill in the rest of the picture. It's the only meter you need on your master bus.

Hawk Loudness Meter on a master bus
Plugin ยท in situ
02 โ€” The Engine

Every measurement. One processing chain.

All of Hawk's meters run simultaneously from the same audio stream. No mode switching, no per-module CPU cost spikes โ€” the full suite is always active from the moment the plugin is inserted.

Hawk full plugin UI showing all measurement modules simultaneously
โ‰‹
LUFS โ€” Four Windows

Momentary (400 ms), Short-Term (3 s), Mid-Term (custom window), and Integrated (full program) LUFS run in parallel โ€” all computed per the K-weighted filter chain defined in ITU-R BS.1770-4. All four values are visible at once, no switching required.

โˆฟ
Spectrum Analyzer โ€” Three Modes

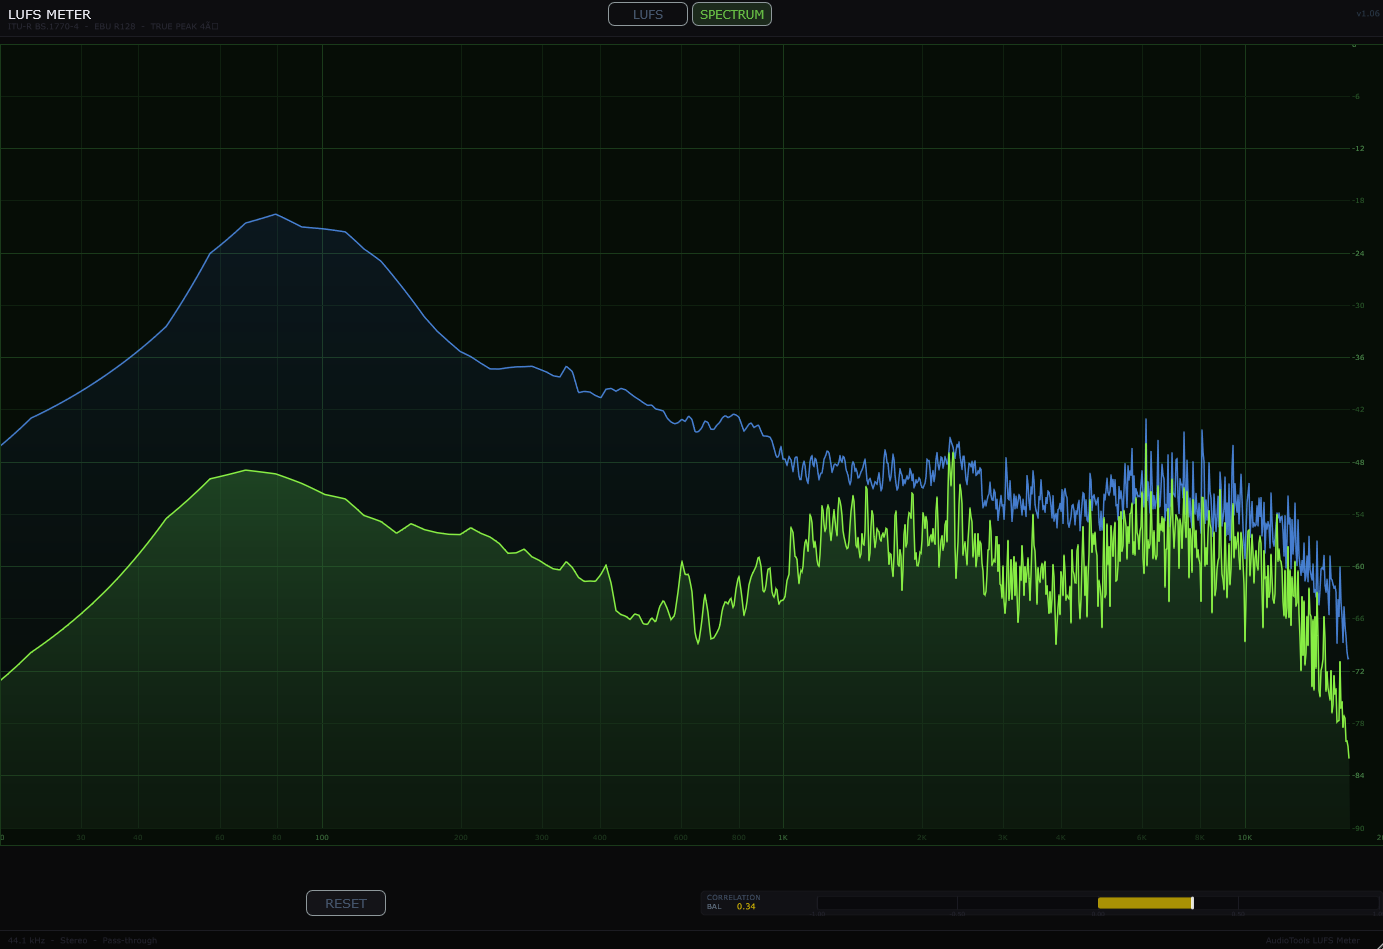
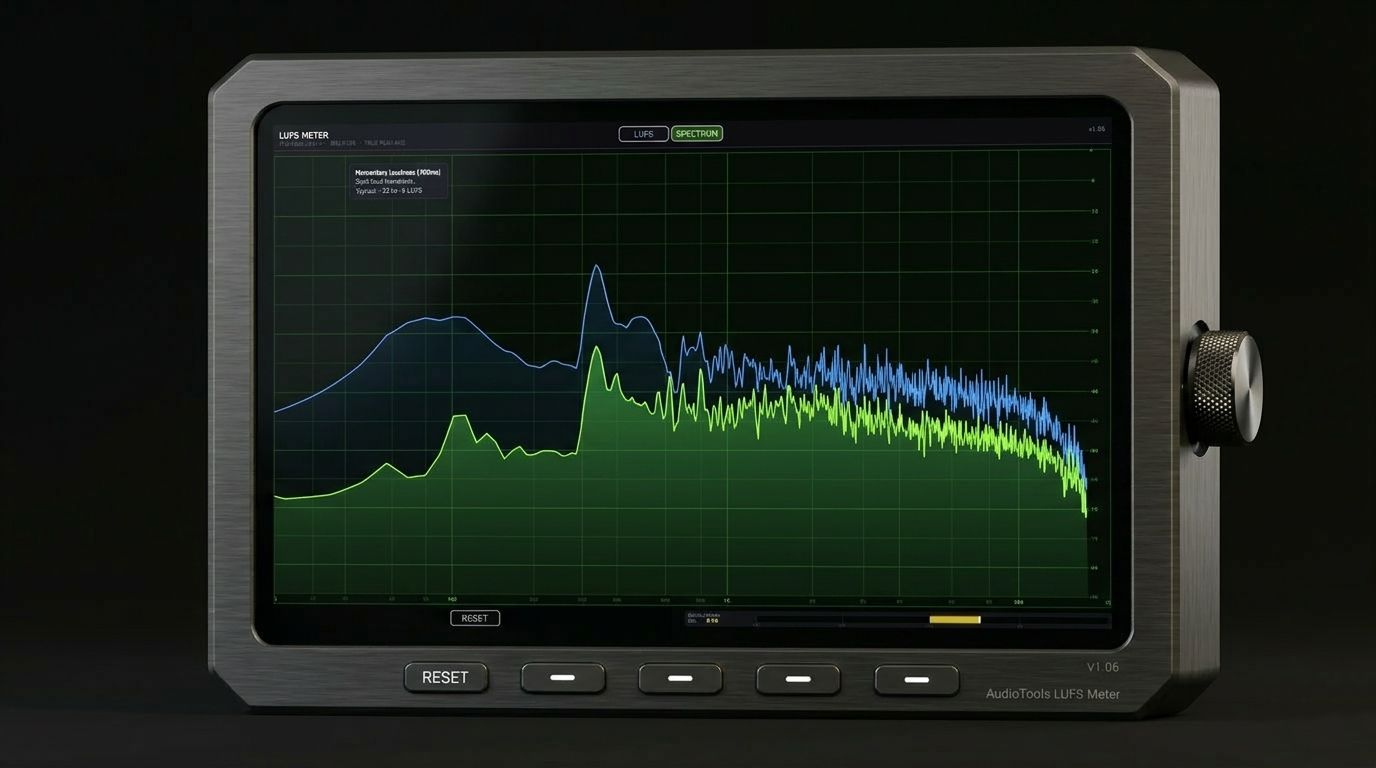
A 4096-point FFT drives three display modes: Classic (instantaneous spectrum), Average (time-averaged spectrum), and Peak Hold (peak-captured spectrum). Switch modes without restarting โ€” the display updates immediately.

โ–ณ
True Peak โ€” 4ร— Oversampling

True Peak uses 4ร— oversampling to detect inter-sample peaks โ€” peaks that occur between sample points and would clip after D/A conversion, even if the sample values themselves are below 0 dBFS. Reported in dBTP per ITU-R BS.1770-4.

โ‡”
Phase Correlation Meter

The phase correlation meter shows the relationship between left and right channels in real time โ€” +1 is perfectly correlated (mono), 0 is uncorrelated, โˆ’1 is anti-phase (mono-cancelling). Essential for checking mix compatibility before submission.

03 โ€” LUFS Windows

Four windows. One complete picture.

Each LUFS window serves a different purpose in the loudness analysis workflow. Hawk displays all four simultaneously so you can see how your mix behaves across every time scale at once.

M
Momentary

400 ms integration window. The fastest LUFS measurement โ€” shows immediate loudness response to transients and dynamic events. Useful for checking individual hits and section transitions.

400 msLUFS-M
S
Short-Term

3-second integration window. Standard for segment comparison โ€” shows the loudness of a phrase, bar, or section. The value most useful for real-time monitoring while mixing.

3 sLUFS-S
MT
Mid-Term

Custom-length integration window between Short-Term and Integrated. Set it to a full verse or chorus length for section-level loudness comparison โ€” bridges the gap between moment and program.

CustomLUFS-MT
I
Integrated

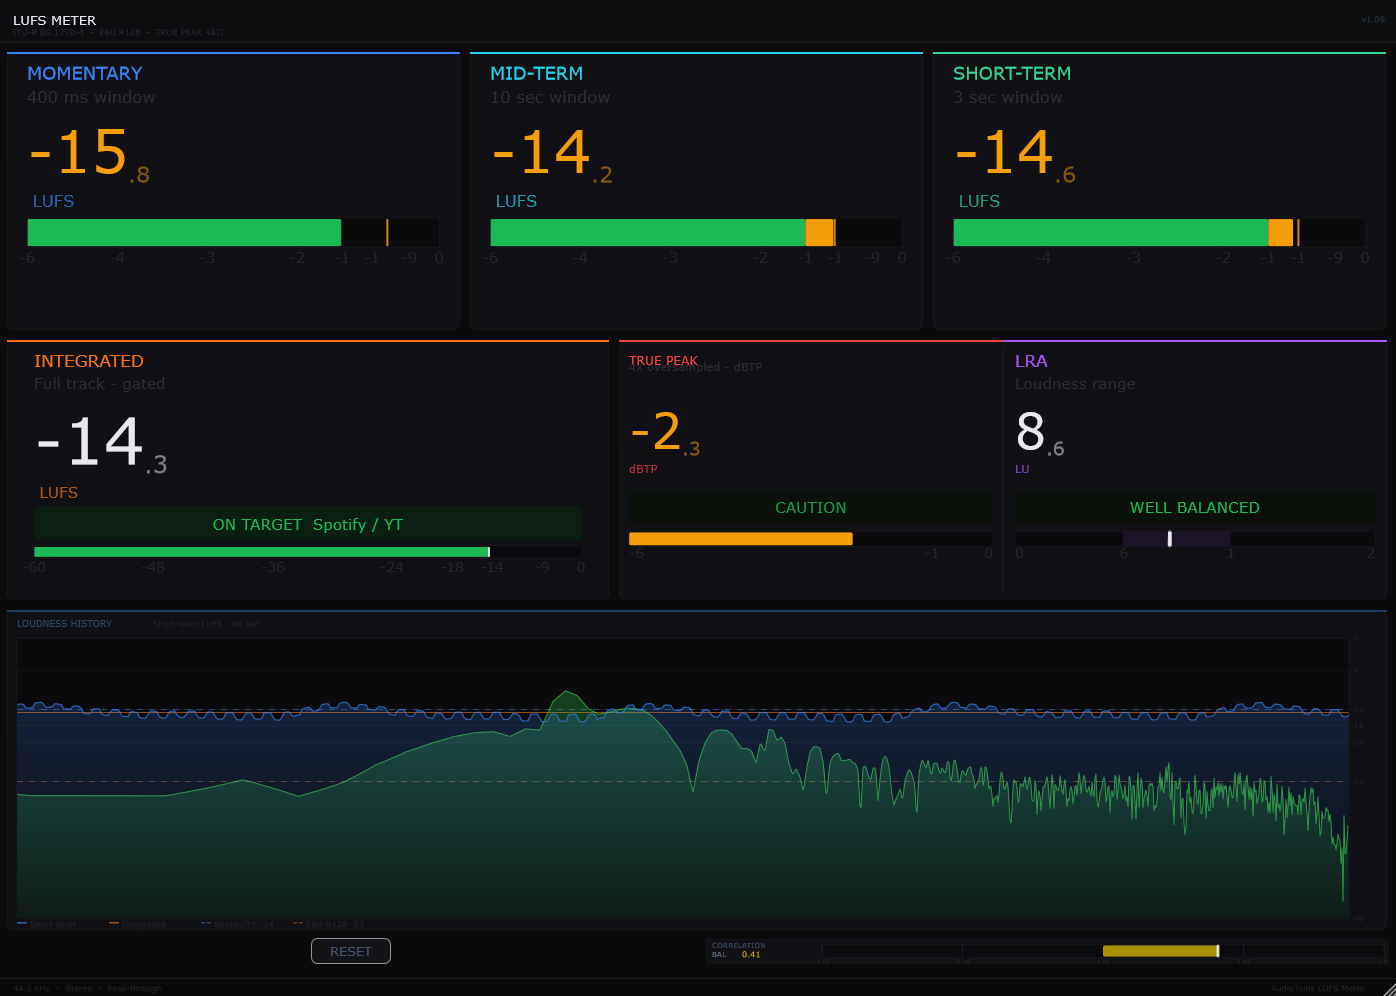
Full-program integrated loudness from playback start, gated per BS.1770-4. The number Spotify, Apple Music, YouTube, and all other platforms use to normalize your track. Hit this target and you sound correct on every platform.

Full programLUFS-I
04 โ€” Spectrum Analyzer

4096-point FFT. Three ways to see it.

Hawk spectrum analyzer in all three display modes
A โ€” Classic
Instantaneous Spectrum

The classic FFT display: real-time frequency content plotted on a logarithmic frequency axis with dB amplitude on the Y axis. Fast response shows you exactly what's in the signal at any given moment. Ideal for identifying resonances and transient content.

B โ€” Average
Time-Averaged Spectrum

The averaged display shows a running average of the FFT over time โ€” slow enough to reveal the overall spectral balance of your mix while smoothing over transient peaks. Reference it against a target mix to compare tonal balance at a glance.

C โ€” Peak Hold
Peak-Captured Spectrum

Peak Hold captures the maximum value seen at each frequency bin since playback started (or since the last reset). Play through a full mix once and the display shows you the spectral envelope of your entire program โ€” useful for identifying frequency ceiling issues before limiting.

05 โ€” True Peak & Phase

Inter-sample peaks. Stereo correlation.

Hawk true peak readout and phase correlation meter
A โ€” True Peak
4ร— Oversampling Detection

Sample values never exceed 0 dBFS, but the waveform between samples can. Hawk upsamples the audio by 4ร— and measures the resulting continuous waveform โ€” the True Peak value catches these inter-sample peaks and reports them in dBTP. The standard ceiling for streaming delivery is โˆ’1 dBTP.

B โ€” Frozen Peak
Max True Peak Hold

The Frozen Peak readout captures and holds the highest True Peak value seen since playback started. Play through a full mix once and the readout tells you the absolute worst-case True Peak of your program โ€” no need to watch it constantly during playback.

C โ€” Phase
Stereo Correlation Meter

A value near +1 means your mix will sound correct and loud in mono. A value near 0 or below means mono compatibility issues โ€” elements may cancel or thin out when the stereo field collapses. Monitor correlation throughout the mix, not just at the end.

06 โ€” History & Goal Line

Where you've been. Where you need to be.

The loudness history graph plots Short-Term LUFS over time โ€” scrolling left as the session progresses. Set a Goal Line and the graph shows you visually how your mix compares to the target across the full program.

Hawk loudness history graph with goal line visible
History Graph
Scrolling LUFS-S

Short-Term LUFS is plotted over time as you play through your mix. Loud sections appear high on the graph; quiet sections dip below. Play from the top and the full loudness arc of your arrangement becomes visible at once.

Goal Line
โˆ’23 to 0 LUFS

Set the Goal Line to your streaming target โ€” โˆ’14 LUFS for Spotify, โˆ’16 LUFS for Apple Music, โˆ’13 LUFS for YouTube. The horizontal line on the history graph shows you how your mix tracks against the target in real time.

Integrated Target
Numeric readout

The Integrated LUFS readout compares against the Goal Line value numerically โ€” showing you how many dB away you are from the target at any point. When playback is complete, this difference tells you exactly how much to adjust your output limiter.

Reset
One click

Reset all measurements โ€” Integrated LUFS, Frozen Peak, and the history graph โ€” with one click. Use it at the start of each full playback so all measurements reflect the current pass from start to finish.

07 โ€” Workflow

Insert once. Know everything.

Hawk LUFS meter showing all four windows simultaneously Hawk full plugin โ€” angled product view
01
Insert Hawk on your master bus or any channel you want to analyze. All measurement modules activate immediately โ€” no configuration needed to get all readings.
02
Set the Goal Line to your delivery target. โˆ’14 LUFS for Spotify and Tidal; โˆ’16 for Apple Music; โˆ’13 for YouTube. The history graph will show you how your mix tracks against it.
03
Click Reset, then play from the beginning of your mix. The Integrated LUFS number builds from zero and accumulates the full program loudness as it plays.
04
Watch Short-Term LUFS during playback to monitor section-level dynamics. Compare drops versus choruses โ€” Hawk shows you whether your arrangement has the loudness contrast you intended.
05
Check Frozen Peak at the end of playback. If it's above โˆ’1 dBTP, your limiter ceiling needs adjusting before export. โˆ’1 dBTP is the standard for streaming delivery.
06
Monitor phase correlation throughout. If it dips toward 0 or below during any section, investigate the stereo width of elements in that section for mono compatibility issues.
07
Once Integrated LUFS matches your Goal Line and True Peak is at or below โˆ’1 dBTP, your mix is ready for export to all major streaming platforms.
08 โ€” Specifications

Everything, on one page.

Format
VST3
Platform
Windows 10 / 11 ยท 64-bit
Version
1.0
Loudness standard
ITU-R BS.1770-4 / EBU R128
LUFS windows
4 โ€” Momentary (400 ms), Short-Term (3 s), Mid-Term (custom), Integrated (full program)
Integrated gating
Per BS.1770-4 โ€” absolute gate โˆ’70 LUFS, relative gate โˆ’10 LU
FFT size
4096 points
Spectrum modes
3 โ€” Classic (instantaneous), Average (time-averaged), Peak Hold (max capture)
True Peak detection
4ร— oversampling โ€” inter-sample peak detection ยท reported in dBTP
Frozen Peak
Maximum True Peak hold since last reset
Phase correlation
Real-time stereo correlation meter ยท range: โˆ’1 (anti-phase) to +1 (mono)
Loudness history
Short-Term LUFS plotted over time ยท scrolling display
Goal Line range
โˆ’23 to 0 LUFS
Reset
One-click reset of Integrated LUFS, Frozen Peak, and history graph
State save
Goal Line and display mode saved with DAW project as XML
09 โ€” Fine Print

Documentation.

DAW
Any VST3-compatible host โ€” Ableton Live 11+, FL Studio 20+, Reaper, Cubase, Studio One, Bitwig. Best placed as the last insert on your master bus, after all processing.
Operating System
Windows 10 or 11 (64-bit). Mac support is planned for a future release.
Format
VST3 only. Works on stereo channels โ€” Hawk is designed for stereo bus use. Mono channels are supported but phase correlation and stereo spectrum modes will reflect the mono-summed signal.
CPU
Moderate โ€” running LUFS across four windows, a 4096-pt FFT, and 4ร— oversampling True Peak simultaneously takes more CPU than a simple level meter. On a modern processor, Hawk uses a small fraction of one core. It's designed to stay inserted on the master bus throughout a session.
Updates
Current release 1.0. Free updates for all future 1.x releases.
v1.0 โ€” Initial Release
First public release. ITU-R BS.1770-4 LUFS across four time windows (momentary, short-term, integrated, loudness range), 4096-point FFT spectrum analyzer with three display modes, 4ร— oversampling True Peak, phase correlation meter, loudness history graph, goal line, and frozen peak hold.
Full User Guide
Step-by-step walkthrough of all LUFS meters, the spectrum analyzer, how to read each display, and common use cases for streaming loudness, frequency balance, and stereo width analysis.
Open User Guide โ†’
Personal & Commercial Use
Use Hawk in any project โ€” music production, mixing, mastering, post-production, broadcast, and live performance. No royalties, no project restrictions.
Single User
One license per user. Install on up to 3 machines you personally own or operate.
Serial Activation
Your license includes a unique serial number tied to your email. Your serial and download are permanently accessible in your Members Area.
Free Updates
All 1.x updates are free. Your serial activates the current version and all future updates in the 1.x line.
No Redistribution
The plugin binaries may not be shared, resold, or redistributed. Each user must obtain their own license.
H
Hawk Loudness Meter ยท VST3
$0