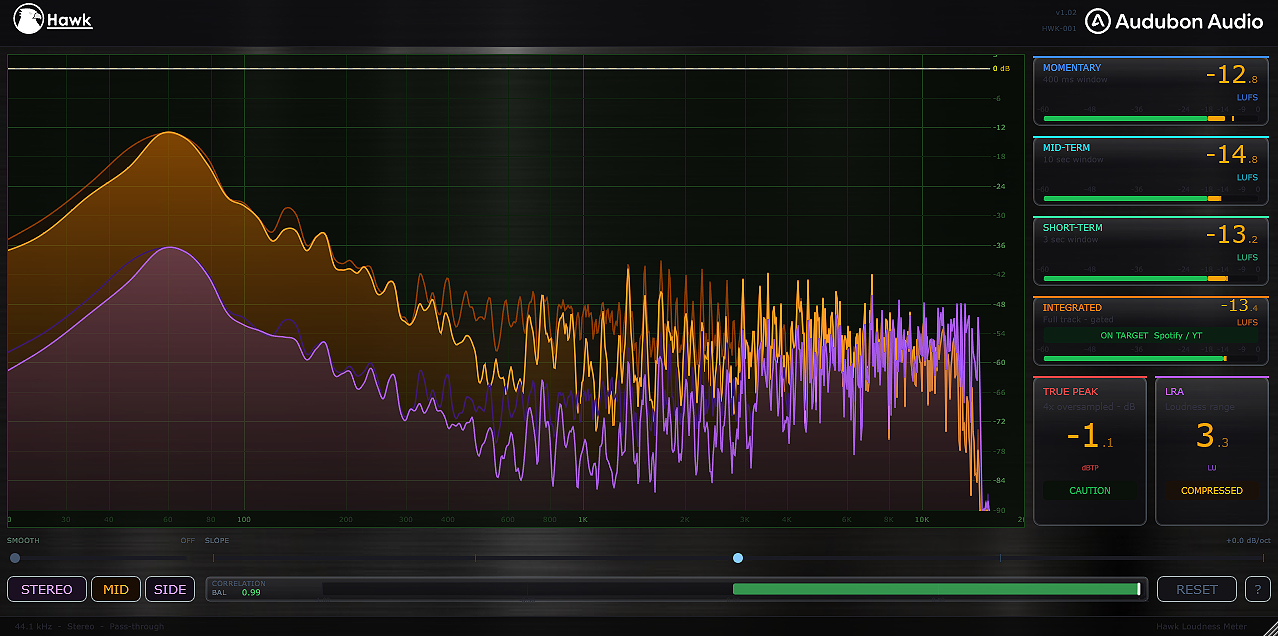
What Hawk does: Hawk is a precision loudness meter that measures your audio against the international broadcast and streaming standard (ITU-R BS.1770 / EBU R128). It gives you Momentary, Mid-Term, Short-Term, and Integrated LUFS readings, plus 4x-oversampled True Peak detection, Loudness Range (LRA), phase correlation, and a full-resolution spectrum analyzer — all in one resizable window.
Loudness Meters
1
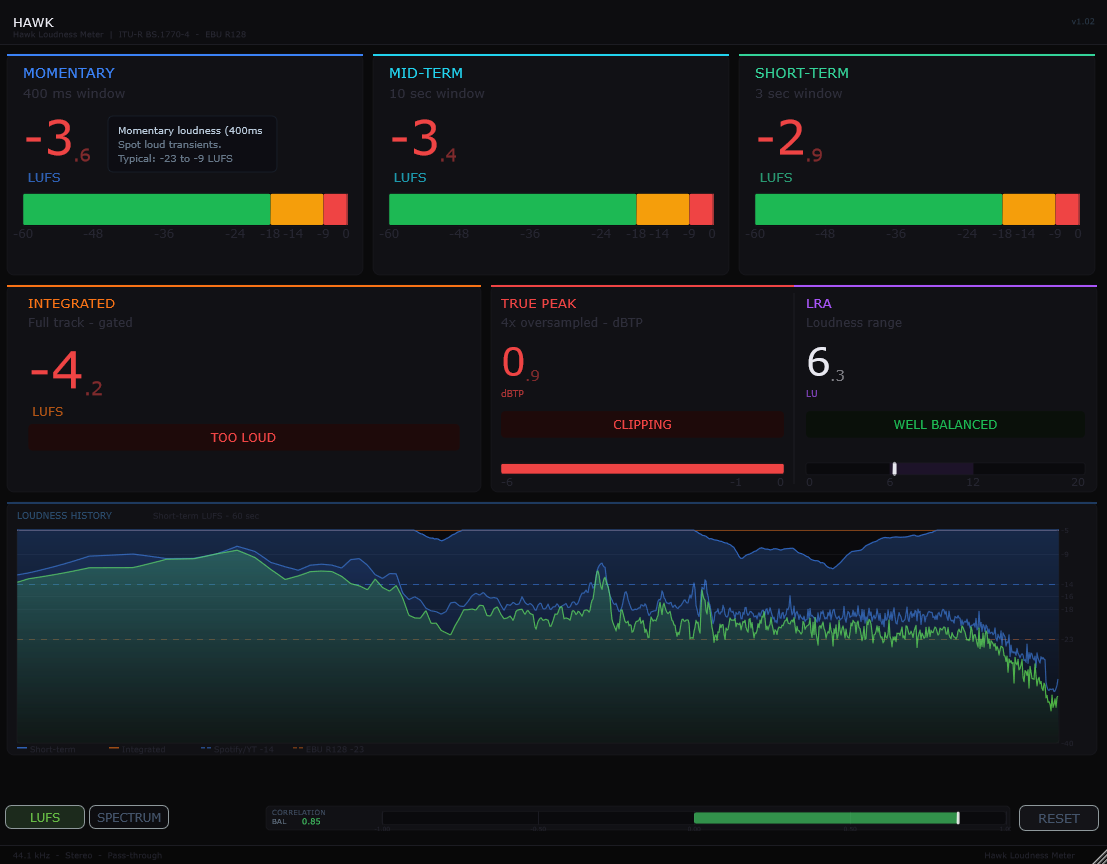
The Four LUFS Panels
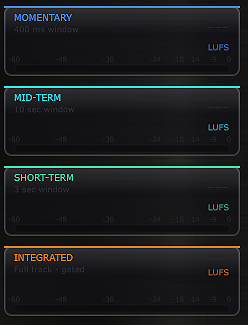
The top row shows four loudness readings, each measuring a different time window. All values are in LUFS (Loudness Units Full Scale) and follow the K-weighting filter defined by the BS.1770 standard — which mimics how human hearing perceives loudness.
Momentary
~400 ms window
The fastest reading. Shows the loudness of the last ~400 ms. Good for watching transient peaks and real-time level monitoring.
Mid-Term
~1 second window
A smoothed view sitting between Momentary and Short-Term. Useful for watching average level over the last second without the noise of the fastest reading.
Short-Term
3 second window
The standard EBU R128 Short-Term measurement. Great for monitoring sections of a track — verses, drops, fills — and checking consistency.
Integrated
Full program, gated
The most important number for delivery. Measures the loudness of the entire program with a -70 LUFS absolute gate and -10 LU relative gate to exclude silence. This is the number streaming platforms check.
2
True Peak & LRA Panel
Below the four LUFS panels sits a two-panel row for True Peak and Loudness Range.
True Peak
dBTP — 4x oversampled
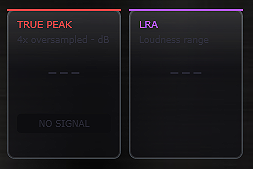
Catches inter-sample peaks that a standard peak meter misses. Hawk uses 4x oversampling to detect these accurately. A status pill shows SAFE, CAUTION, NEAR CLIP, or CLIPPING at a glance. Keep True Peak at or below −1 dBTP for streaming delivery.
LRA
Loudness Range (LU)
The spread between the quietest and loudest parts of your track. A higher number means more dynamic variation. Typical music lands 6–12 LU. Broadcast targets 5–15 LU. Very compressed material may be below 4 LU.
3
Phase Correlation Meter
The thin horizontal bar shows the phase relationship between the left and right channels. A reading near +1 means the channels are in phase (mono compatible). A reading near 0 means no correlation — typical for well-produced stereo. A reading near −1 means the channels are out of phase, which will cancel badly when summed to mono. Keep an eye on this if your mix will be heard on phones, earbuds, or club systems.
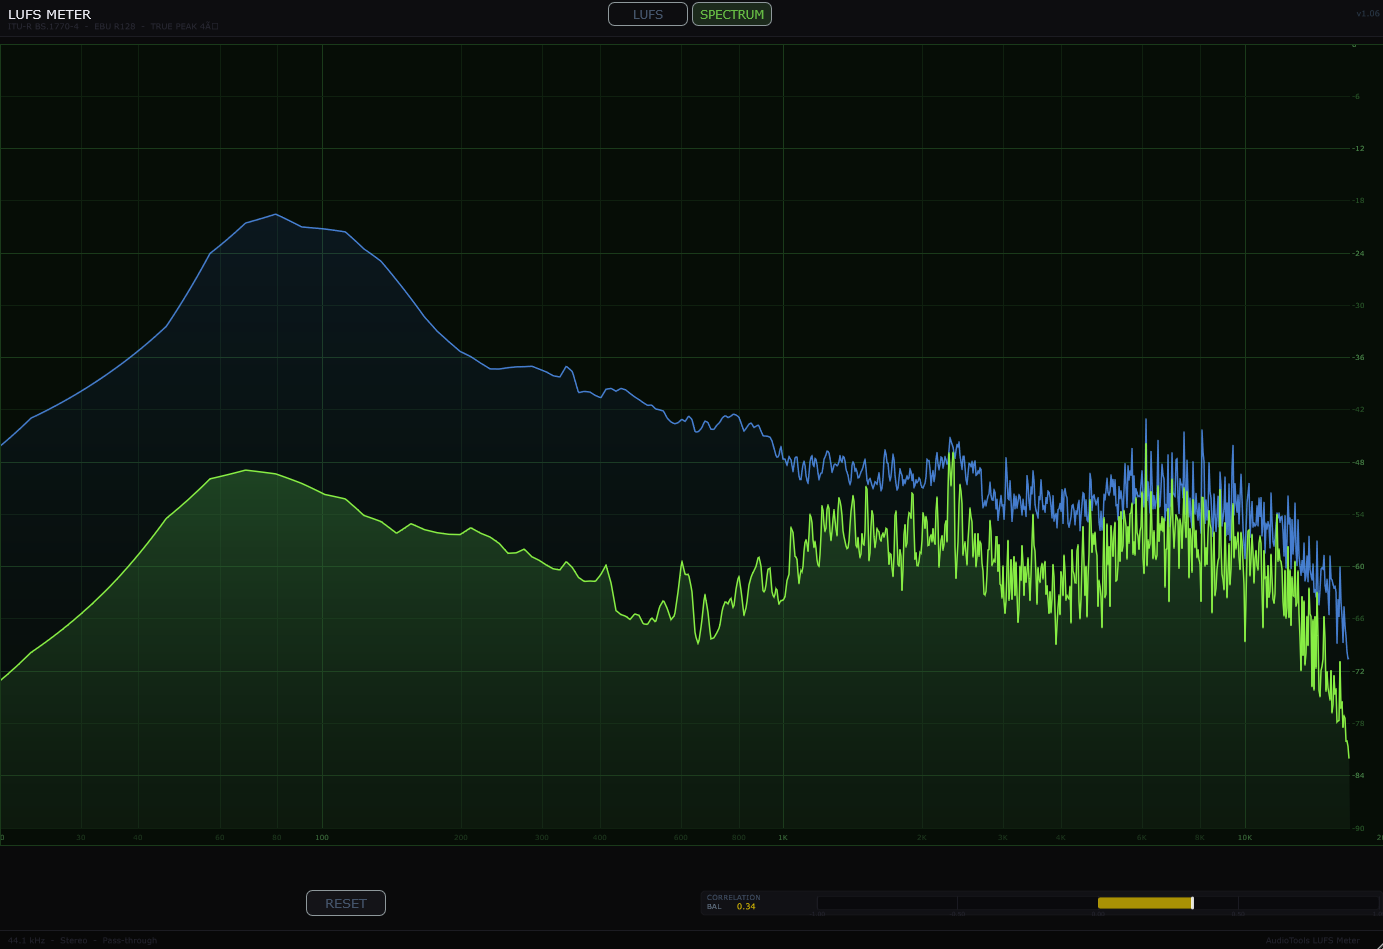
Spectrum Analyzer
4
Spectrum Display
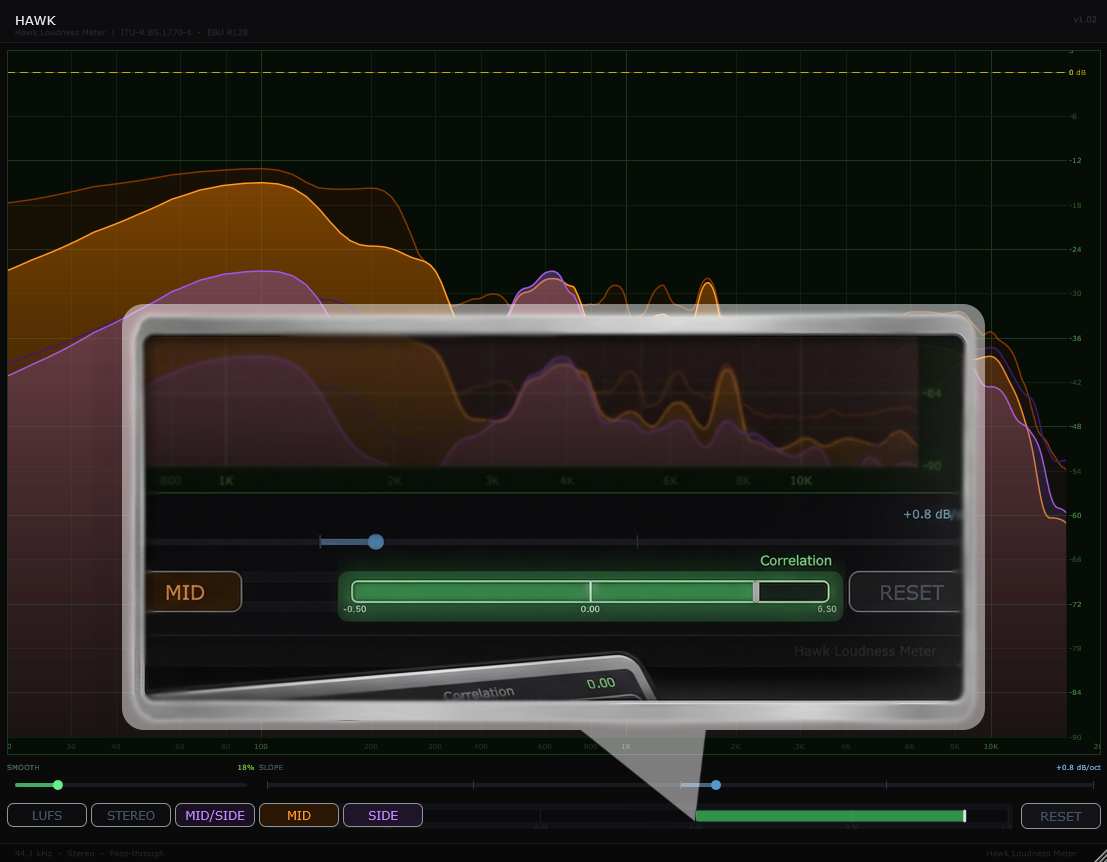
The large lower panel is a full-resolution spectrum analyzer running from 20 Hz to 20 kHz on a log scale. The green filled curve shows the live spectrum. The blue line is a slow-release peak hold that tracks the highest level each frequency bin has reached, giving you a clear picture of your frequency balance over time. The yellow goal line is draggable — click and drag it vertically to set a target level reference. Grey frozen peak markers lock in the highest sustained peaks above the goal line as you play.
5
Spectrum Controls
A toolbar at the bottom of the spectrum gives you several tools for shaping what you see.
Smooth
0% – 100%
Applies a spatial blur across frequency bins. Low values give you a precise, detailed view. Higher values smooth out the curve to show broad tonal balance more clearly — useful when mixing for frequency area decisions.
Slope
−9 to +9 dB/oct
Tilts the displayed spectrum by dB per octave, referenced at 1 kHz. A +3 dB/oct tilt compensates for the natural high-frequency rolloff in most music, making a balanced mix appear flat. Useful for referencing against loudness standards.
MID/SIDE
Toggle
Switches the spectrum analyzer into Mid/Side mode. The Mid signal (mono sum) and Side signal (stereo difference) are displayed separately, letting you check how wide your mix is at each frequency. Use MID and SIDE buttons to show or hide each.
Reset
Button
Clears all LUFS readings, True Peak, LRA, and the frozen peak markers in the spectrum. Hit this at the start of a new listening session or before measuring a new track.

Common Use Cases
A
Mastering for Streaming
Place Hawk on your master bus as the last plugin in the chain. Play your track from start to finish, then read the Integrated value. Most streaming platforms normalize to between −14 and −16 LUFS Integrated — Spotify targets −14 LUFS, Apple Music −16 LUFS, YouTube −14 LUFS. Adjust your master level until Integrated hits your target, keeping True Peak at or below −1 dBTP throughout. Hit Reset and play again to confirm.
B
Checking Frequency Balance
Use the spectrum to compare your mix against a reference track. Load a reference into your DAW, A/B between the two with Hawk on the master, and watch where the peaks land relative to each other. Enable the Slope slider at around
+3 dB/oct to apply a pink noise compensation tilt — a well-balanced mix will appear roughly flat after this correction. The frozen grey peaks help you see the maximum energy at each frequency over a full playthrough.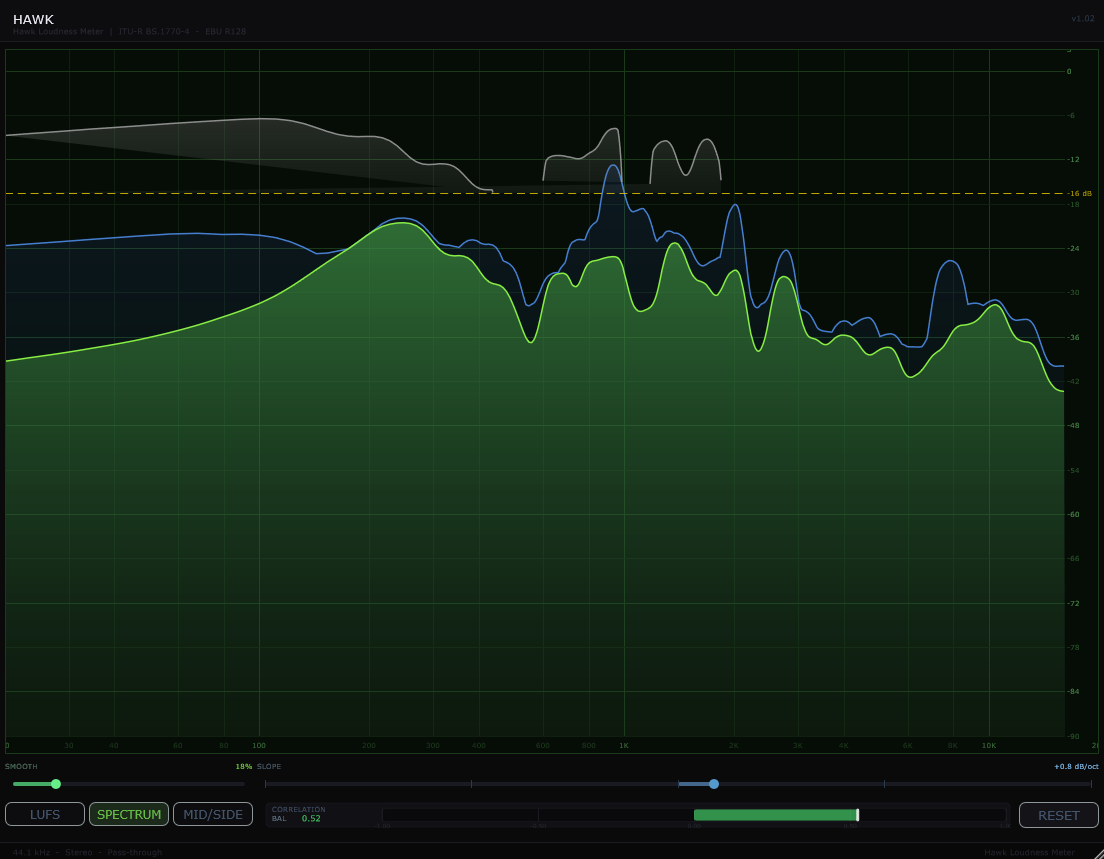
C
Checking Stereo Width & Mono Compatibility
Switch Hawk into MID/SIDE mode and watch the spectrum. If the Side signal is much louder than the Mid at low frequencies (below ~200 Hz), your bass may fold out of phase when summed to mono. A healthy mix typically has a strong Mid in the lows and increasingly wide Side energy in the mids and highs. Also keep the Phase Correlation meter above 0 — anything going negative regularly is worth investigating.